Bridging the Data Gap in Policymaking: The Role of AI and Alternative
Data
Governments are far behind in the race to leverage big data. Can
generative AI help level the playing field?
April 10, 2024 | Written by Hugo Zlotowski (Policy Advisor, AI Economics Unit)
Read article
 In the digital age, governments are no longer the only entities
collecting data on citizens.
In the digital age, governments are no longer the only entities
collecting data on citizens.
More alarmingly, private companies have become more efficient than
administrations at gathering information. Traditional governmental
methods - telephone surveys, forms and in-person interviews - continue
to be the benchmark in accuracy, yet their inherent inefficiencies are
becoming more apparent. In a typical OECD country, over 3,000
employees work in the National Statistics Department, undertaking the
heavy lifting of government data collection.
Costly and inefficient cycles that span years from inception to
completion stand in stark contrast to the real-time analytics deployed
by tech giants. Their platforms are capable of monitoring millions of
users daily, highlighting the growing need for faster and leaner
techniques to complement traditional data collection approaches.
The company behind Facebook and Instagram, Meta, has collected data on
77% of all internet users with about 3.9 billion people active on at
least one of its platforms (as of Q3 2023 Statista).
Number of users in billions
i
Facebook alone had 3 bn active monthly users as of Q3 2023.
The issue is not limited to collection methodologies. National
statistics departments struggle to provide the granular, timely data
required for modern policymaking. In emerging countries, the data
itself is often incomplete: the informal economy, which accounts for
15% of the OECD's GDP, remains largely uncharted by conventional
methods, highlighting a gap in government data.
The Middle East mirrors this global trend of data disparities,
grappling with the challenge of providing updated and granular data of
quality.
The availability of government data in the Middle East and North
Africa (MENA) region is 44% lower than the global average, and 54%
lower than that of the G20, signaling a significant lag in data
transparency and accessibility. Only about half the countries in the
MENA region are up to date with their health, labour force, and
consumption surveys (Data & Policy, 2022).
In the Middle East, Governments provide more limited quality data...
Open Data Barometer Global Report
> Data availability score of UAE is
54% lower than world
average
> Data availability score of MENA is
44% lower than world
average
...as do businesses...
Business Data Transparency Index
Number of users in billions
At the same time, policymaking is increasingly granular (See
Whiteshield's Citizen Navigator). As governments create dynamic policies
that are tailored to individual citizens, the need for timely and
detailed insights becomes critical. To navigate this new terrain,
governments must evolve by adopting big data and AI-driven analytics.
Whiteshield's AI Economics Unit is at the forefront of integrating
advanced AI capabilities into practical applications. Our latest
research showcases the remarkable potential of new AI tools to support
data collection for regional economic assessment.
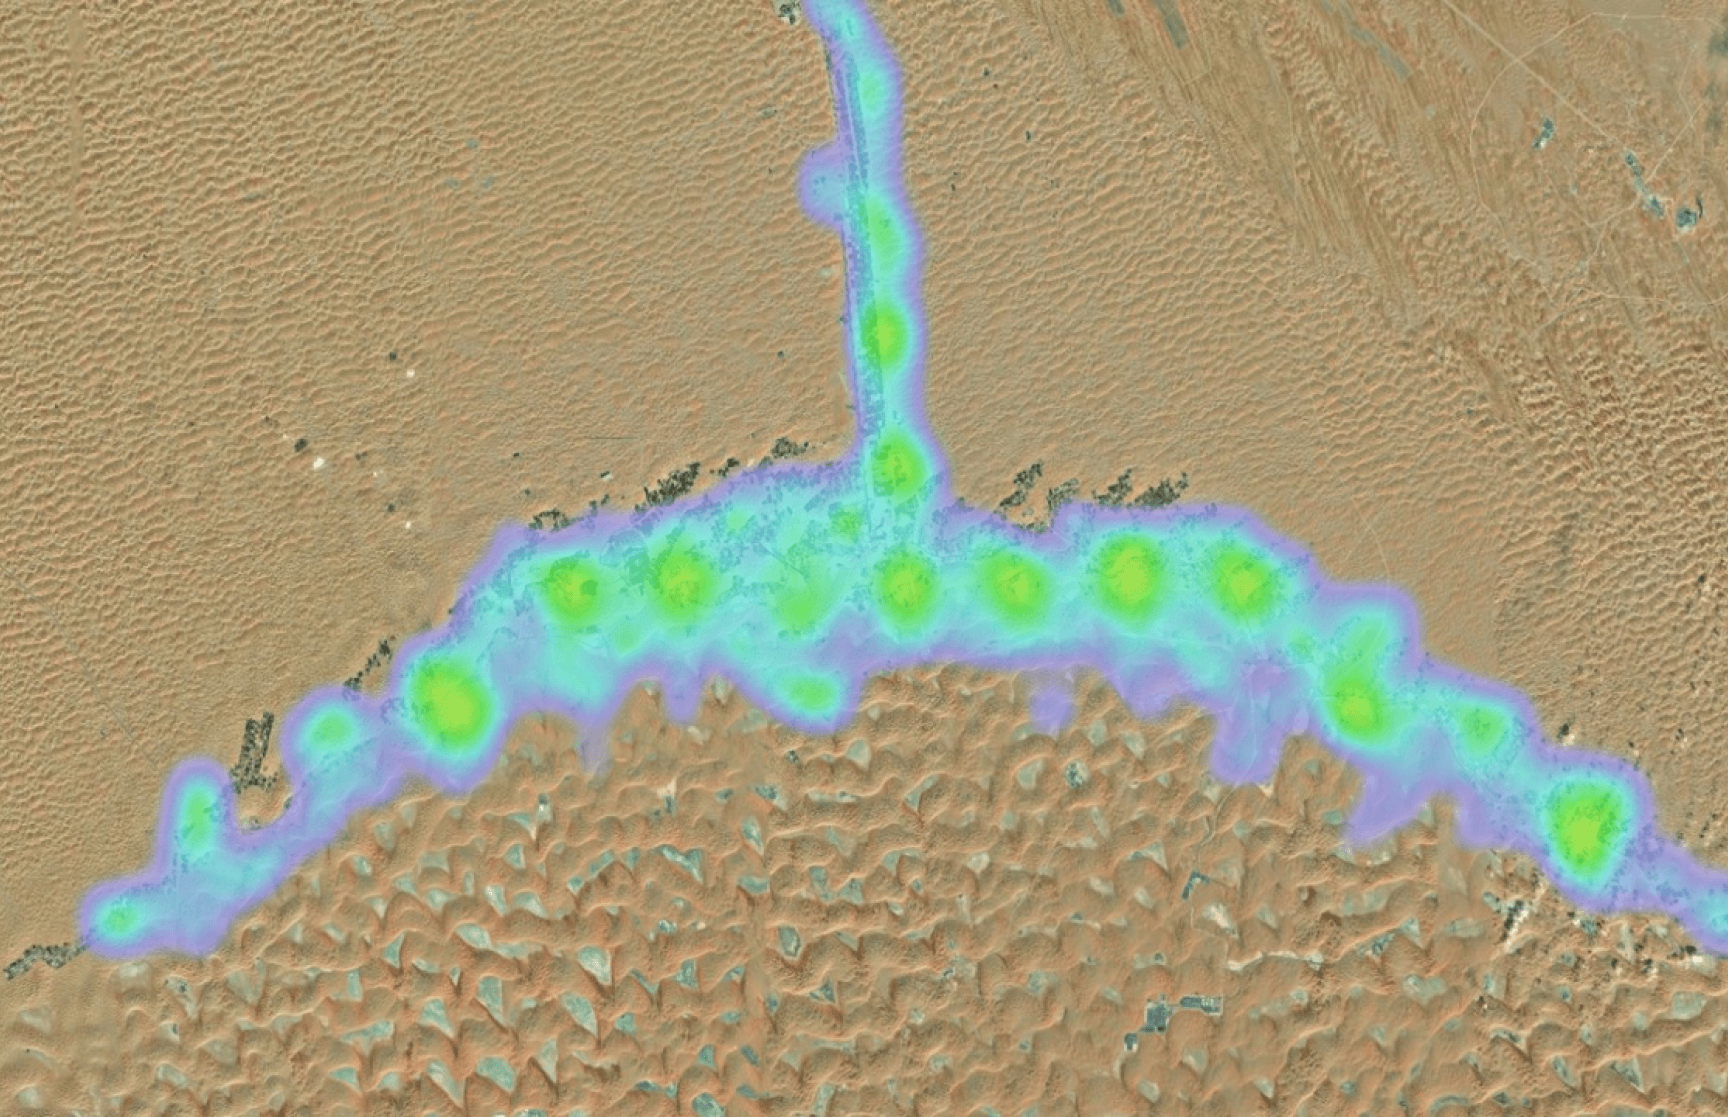
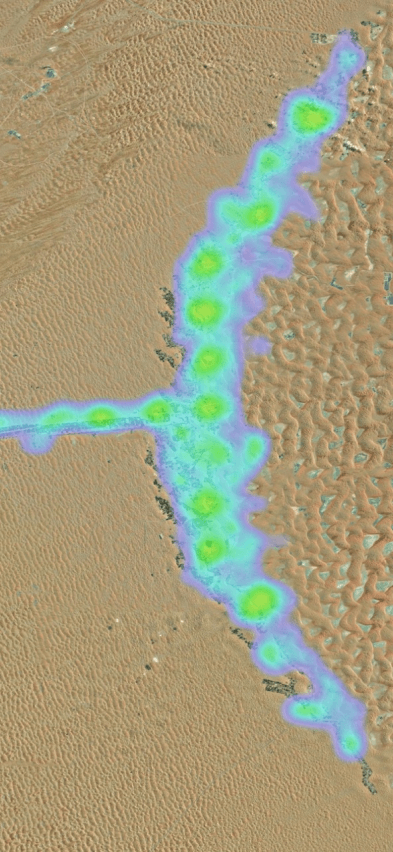
Transforming Satellite Imagery into Economic Insights
In assessing a region's economic health, the conventional barometer has
been its Gross Regional Product (GRP), similar to GDP on a more
localised scale. This measure is central to policymakers' ability to
formulate nuanced, region-specific strategies. But in many emerging
countries, where robust data is still often scarce, Whiteshield has
turned to innovative approaches, notably the use of satellite imagery,
to measure regional economic performance.
To achieve this, the process involves breaking down satellite images
into smaller, manageable pieces. These pieces are then analysed by
artificial intelligence algorithms. Specifically, the current
state-of-the-art is a type of machine learning known as Convolutional
Neural Networks (CNNs). These networks require humans to first prepare
extensive sets of example images, each one meticulously categorized by
hand, to teach the system how to recognize various features. This
process is both resource-intensive and technically challenging,
particularly in developing countries with unique landscapes, such as
those in the Middle East.
The Power of Language Models in Regional Analysis
Whiteshield is leading the way with an innovative solution in this
field. The AI Economic Analysis Tool uses Large Language AI Models, such
as OpenAI's GPT-4, to analyse satellite images. This approach is gaining
recognition for its potential versatility across different fields of
socio-economic research, in contrast with current expert systems which
are tailored for specific tasks.
In a study examining 72 detailed satellite images of Dubai, the two
different methods were compared for accuracy. The first method, a
Convolutional Neural Network (CNN), was trained using images that
had been pre-labelled by humans.
After several days of training, this method made errors amounting to
7.32% on average. In contrast, a newer approach using the AI
Satellite Economic Analysis Tool and GPT-4, which did not rely on
any pre-labelled images and took only minutes to run, achieved an
error rate of 11.9%.
While slightly less accurate overall, Whiteshield's approach showed
superior performance at identifying buildings and roads, which are key
elements in assessing economic health.
The Whiteshield approach outperforms the current method in building
and road identification.
Dubai dataset experiment - Average model error by category
Current method (CNN)
WhiteShield approach (LLM)